Table des matières
Cours 2023 provisoire: https://bvdp.inetdoc.net/files/iut/cours_vision_but3_2023.pdf
Planning du module
CM 3/11
- initiation à la vision
- spectre électromagnétique
- comparaison caméras avec la vision humaine
- capteurs d'images passifs
TD/TP 3-4/11
- installation des outils
- prise en main OpenCV
- chargement et affichage image
- caractérisation d'une image bitmap: résolution, rapport d'aspect, format, poids, compression
- manipulation image: ROI
- génération de dégradé par synthèse
TD/TP 5/11
- tracé de textes, lignes, rectangles, croix
- espaces de couleurs RGBA, YUV, HSV, grey
- décimation chromatique
- segmentation par seuillage dans l'espace HSV
- effacement fond vert par opérateurs de masquage
CM/TD 7/11
- cours traitement d'image
- filtrage gaussien
- opérateurs morphologiques
CM 10/11
- cours capteurs pour la robotique
TD/TP 10/11
- démonstration caméras industrielle ueye
- réglage focale, zoom, ouverture
- réglage durée d'exposition, gain, lut, horloge, ROI…
- démonstration caméra RGBD Realsense (pas eu le temps)
TD/TP 12/11
- fin CM traitement d'image
- début TP seuillage
TD/TP 14/11 et 17/11
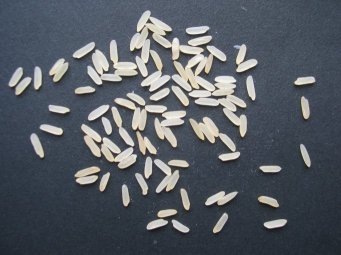
- début détection/localisation/comptage riz
- conversion RGB→gris
- analyse d'histogrammes
- seuillage manuel et adaptatif par méthode d'Otsu
- seuillage adaptatif local
- début opérateurs morphologiques (érosion…)
- fin opérateurs morphologiques (érosion…)
- extraction des contours
- calcul des caractéristiques géométriques des contours (périmètre, aire…)
- détermination d'un algorithme de classification simple à base de seuils
CM 17/11
- cours géométrie pour la vision
TD/TP 17/11 et 18/11
- application du modèle direct de la camera pour la synthèse
- calcul des paramètres intrinsèques et extrinsèques théorique
- Paramètres intrinsèques et extrinsèques en pratique
- génération de l'image d'un cube en rendu filaire
TD/TP 19/11
- Etalonnage de capteur (balance) et ajustement de paramètres du modèle
TD/TP 24/11
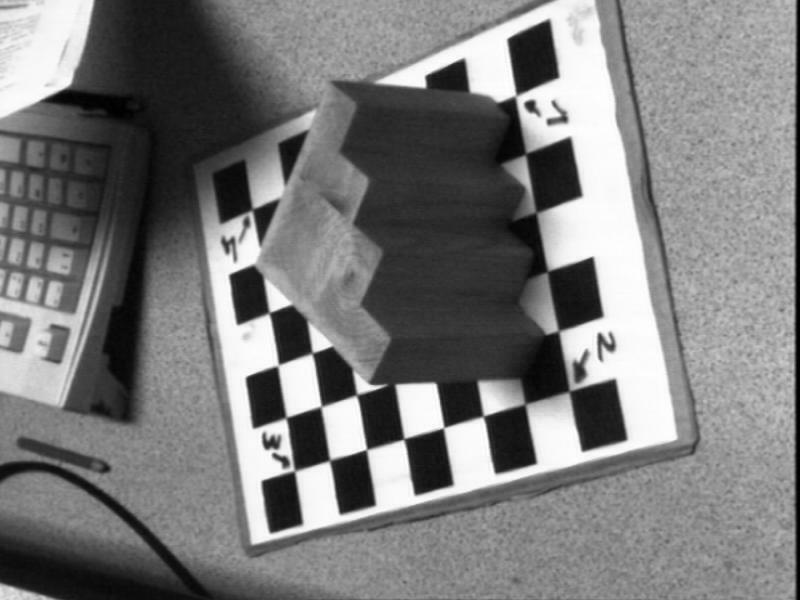
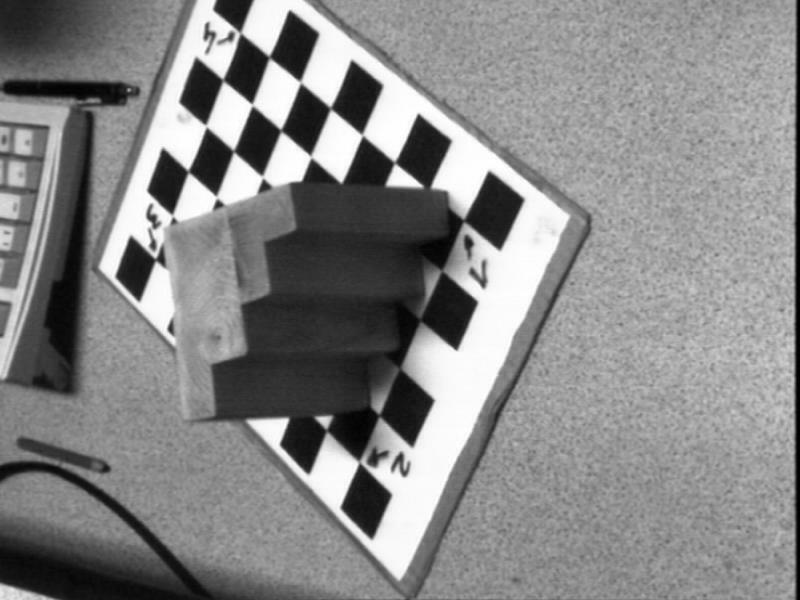
- reconstruction de modèle 3D par vision monoculaire et stéréoscopique
Installations des outils pour travailler chez vous
Visual Studio Code
Installer Visual Studio Code: https://code.visualstudio.com/download
Nomacs
Logiciel pour visualiser les images, alternative à geeqie: https://nomacs.org/ https://github.com/nomacs/nomacs/releases/latest/download/nomacs-portable-win.zip
version portable téléchargeable: https://bvdp.inetdoc.net/files/iut/nomacs-portable-win.zip
régler la langue en anglais
Cliquer sur Panels→Toolbars→Statusbar pour afficher les informations sur l'image en bas à droite.
Pour relever des coordonnées de pixels dans les images, lire en bas a gauche.
Installation OpenCV
Taper dans une invite de commande:
pip install numpy matplotlib opencv-python --upgrade
Premier programme Python/OpenCV
Créer un dossier sur P:\etu-new\2024-2025\s5aii\s5aiiX\nom_prenom\tpvision et y télécharger le fichier suivant:
- test1.py
import numpy as np
import cv2
import math
print("version openCV:"+str(  cv2.__version__ ))
Lancer Visual Studio Code:
Bureau->Applications locales geii->Visual Studio Code
Ouvrir le dossier que vous venez de créer:
File->Open Folder, choisir, puis cliquer sur sélectionner le dossier

Run->Start Debugging

si VSCode indique qu'il n'y a pas d'extension python;   cliquer sur install  coté de Python IntelliSense(Pylance) Microsoft
Documentation OpenCV
https://pypi.org/project/opencv-python/
lien vers documentation openCV: https://docs.opencv.org/4.8.0/
TD1 Prise en main librairie OpenCV via Python
Nous allons commencer par prendre en main la librairie OpenCV via le langage Python: https://opencv24-python-tutorials.readthedocs.io/en/latest/py_tutorials/py_tutorials.html
Image à télécharger dans votre dossier de projet
Solution TD1
- td1.py
import numpy as np
import cv2
import math
print("version openCV:"+str(  cv2.__version__ ))


img = cv2.imread('img.jpg',cv2.IMREAD_COLOR)

print(img)

print(type(img))

print(img.shape)
print(img.dtype)
print("rapport d aspect: "+str(img.shape[1]/img.shape[0]))

print("pixel en 1,1:"+str(img[1][1]))

img[1][1][1]=255
img[1][1][0]=0
img[1][1][2]=0

print("pixel en 1,1:"+str(img[1][1]))


#cv2.imwrite('imggray.png',img)
#cv2.imwrite('imggray.jpg',img)


ball = img[280:340, 330:390]
img[273:333, 100:160] = ball


haut=60
larg=60
v0=264
u0=700
ball = img[v0:v0+haut, u0:u0+larg]
for n in range(3):
  v1=224
  u1=442
  img[v1:v1+haut, n*100+u1:n*100+u1+larg] = ball


for n in range(256):
  for m in range(256):
    img[n][m][0]= m
    img[n][m][1]= 0
    img[n][m][2]= n


cv2.imwrite('imgcolor.png',img)
#
cv2.imshow('image',img)
cv2.waitKey(0)
cv2.destroyAllWindows()
TD2 Espaces colorimétriques
Espace colorimétrique YUV: https://fr.wikipedia.org/wiki/YUV
Décimation chromatique en YUV: https://www.latelierducable.com/tv-televiseur/yuv-420-ycbcr-422-rgb-444-cest-quoi-le-chroma-subsampling/ et https://wiki.videolan.org/YUV/
Espace colorimétrique HSV (TSV en français): https://fr.wikipedia.org/wiki/Teinte_Saturation_Valeur
https://fr.wikipedia.org/wiki/Cercle_chromatique#/media/Fichier:CYM_color_wheel.png
Aliasing
https://mathworld.wolfram.com/MoirePattern.html
https://www.lesnumeriques.com/photo/qu-est-ce-que-le-moire-pu121721.html
https://www.techno-science.net/glossaire-definition/Moire-effet-de-contraste.html
DCT pour jpeg
https://fr.wikipedia.org/wiki/Transform%C3%A9e_en_cosinus_discr%C3%A8te
http://compressionimage.free.fr/dct/
Décimation chromatique pour jpeg
https://fr.wikipedia.org/wiki/Sous-%C3%A9chantillonnage_de_la_chrominance
- td2.py
import numpy as np
import cv2
import math
print("version openCV:"+str(  cv2.__version__ ))

img = cv2.imread('img.jpg')

print(img)
print(type(img))
print(img.shape)

print(img[637][633][:])

img[637][633][0]= 255
img[637][633][1]= 0
img[637][633][2]= 0

haut=60
larg=60
v0=264
u0=700
ball = img[v0:v0+haut, u0:u0+larg]
for n in range(3):
  v1=224
  u1=442
  img[v1:v1+haut, n*100+u1:n*100+u1+larg] = ball


cv2.line(img,(0,0),(511,511),(255,0,0),1,cv2.LINE_AA)

hsv = cv2.cvtColor(img, cv2.COLOR_BGR2HSV)

# define range of blue color in HSV
lower_green = np.array([35,0,0])
upper_green = np.array([85,255,255])

# Threshold the HSV image to get only blue colors
mask = cv2.inRange(hsv, lower_green, upper_green)

# Bitwise-AND mask and original image
res = cv2.bitwise_and(img,img, mask= mask)


for m in range(256):
  for n in range(256):
    img[n][m][0]= m
    img[n][m][1]= 0
    img[n][m][2]= n


for m in range(img.shape[1]):
  for n in range(img.shape[0]):
    g=(m%2)*255
    img[n][m][0]= g
    img[n][m][1]= g
    img[n][m][2]= g


#cv2.line(img,(0,0),(511,511),(255,0,0),1,cv2.LINE_4)


font = cv2.FONT_HERSHEY_SIMPLEX
cv2.putText(img,'OpenCV',(10,500), font, 4,(255,255,255),2,cv2.LINE_AA)


flags = [i for i in dir(cv2) if i.startswith('COLOR_')]
print(flags)

'''

Enumerator
FILLED
Python: cv.FILLED
LINE_4
Python: cv.LINE_4
4-connected line
LINE_8
Python: cv.LINE_8
8-connected line
LINE_AA
Python: cv.LINE_AA
antialiased line
'''
#cv2.imshow('image',img)

cv2.imshow('image',res)

cv2.waitKey(0)
cv2.destroyAllWindows()


#cv2.imwrite('imggray.png',img)
#cv2.imwrite('imggray.jpg',img)#cv2.imwrite('imggray.jpg',img)

cv2.imwrite('imgcolor.png',img)
Détection et comptage d'objets
- td3.py
import numpy as np
import cv2
import math
print("version openCV:"+str(  cv2.__version__ ))

img = cv2.imread('riz2.jpg',0)


# Appliquer le facteur 1/2 aux valeurs des pixels pour tester le seuil adaptatif
#img = (img / 2).astype(np.uint8)
#ou
#img = cv2.convertScaleAbs(img, alpha=0.5, beta=0)

ret,thresh1 = cv2.threshold(img,127,255,cv2.THRESH_BINARY)


# Otsu's thresholding
ret2,th2 = cv2.threshold(img,0,255,cv2.THRESH_BINARY+cv2.THRESH_OTSU)

print("ret2:"+str(ret2))
print(img)
print(type(img))
print(img.shape)


kernel = np.ones((3,3),np.uint8)
erosion = cv2.erode(th2,kernel,iterations = 2)

#affichage difference
#cv2.imshow('image',th2-erosion)
dilation = cv2.dilate(erosion,kernel,iterations = 1)

cv2.imwrite('dilation.png',dilation)
#affichage difference
#cv2.imshow('image',th2-dilation)

imgcolor = cv2.cvtColor(dilation, cv2.COLOR_GRAY2BGR)
cpt=0
contours, hierarchy = cv2.findContours(dilation,cv2.RETR_TREE,cv2.CHAIN_APPROX_NONE)
for contour in contours:
    print("The contours have this data " +str(contour))
    M = cv2.moments(contour)
    print(str(M))

    cx = int(M['m10']/M['m00'])
    cy = int(M['m01']/M['m00'])
    imgcolor[cy][cx]=[255,0,0]
    area = cv2.contourArea(contour)
    perimeter = cv2.arcLength(contour,True)
    hull = cv2.convexHull(contour)
    rect = cv2.minAreaRect(contour)
    aspectratio=max(rect[1])/min(rect[1])
    hullarea = cv2.contourArea(hull)
    #box = cv2.boxPoints(rect)
    #box = np.int0(box)
    solidity=float(area)/hullarea
    #if cpt%2==0:
    if area>20 and area<200 and aspectratio> 2 and  aspectratio<6 and solidity>0.8:
      cv2.drawContours(imgcolor,contour,-1,(0,255,0),1)
    else:
      cv2.drawContours(imgcolor,contour,-1,(0,0,255),1)
    cpt=cpt+1


cv2.imshow('image',imgcolor)

cv2.waitKey(0)
cv2.destroyAllWindows()
Exercice à faire
TD/TP géométrie pour la vision
TP synthèse d'image
Lien vers doc pour paramétrisation de Rodrigues: https://docs.opencv.org/2.4/modules/calib3d/doc/camera_calibration_and_3d_reconstruction.html?highlight=pnp#void%20Rodrigues(InputArray%20src,%20OutputArray%20dst,%20OutputArray%20jacobian)
Lien vers doc pour modèle de caméra et étalonnage: https://docs.opencv.org/2.4/modules/calib3d/doc/camera_calibration_and_3d_reconstruction.html
Fichier de départ:
- synthese.py
#!/usr/bin/python3
import cv2
import numpy as np
import math
print("==============================================================")
#modèle 3D filaire d'un cube:
taillecube=1 #unité métrique pour le coté du cube
listeM = np.float32([[0,0,0], [taillecube,0,0],[taillecube,taillecube,0], [0,taillecube,0],
                   [0,0,taillecube], [taillecube,0,taillecube],[taillecube,taillecube,taillecube], [0,taillecube,taillecube]])
print("listeM:"+str(listeM))
listeseg=[[0,1],[1,2],[2,3],[3,0],[4,5],[5,6],[6,7],[7,4],[0,4],[1,5],[2,6],[3,7]]
print("listeseg:"+str(listeseg))
print("==============================================================")
Solution TD:
- synthese.py
#!/usr/bin/python3
import cv2
import numpy as np
import math
print("==============================================================")
#modèle 3D filaire d'un cube:
taillecube=1 #unité métrique pour le coté du cube
listeM = np.float32([[0,0,0], [taillecube,0,0],[taillecube,taillecube,0], [0,taillecube,0],
                    [0,0,taillecube], [taillecube,0,taillecube],[taillecube,taillecube,taillecube], [0,taillecube,taillecube]])
print("listeM:"+str(listeM))
listeseg=[[0,1],[1,2],[2,3],[3,0],[4,5],[5,6],[6,7],[7,4],[0,4],[1,5],[2,6],[3,7]]
print("listeseg:"+str(listeseg))
print("==============================================================")


    #https://docs.opencv.org/2.4/modules/calib3d/doc/camera_calibration_and_3d_reconstruction.html?highlight=pnp#void%20Rodrigues(InputArray%20src,%20OutputArray%20dst,%20OutputArray%20jacobian)
rvecs=(math.pi/4.)*np.float32([0,0,1])
print(str(rvecs))
rot, jacobian=cv2.Rodrigues(rvecs)
print(str(rot))
print(str(jacobian))
tvecs=np.float32([[3,-1,5]]).transpose()
print(str(tvecs))

cRTw=np.concatenate(  (rot,tvecs)  ,axis=1)
print(str(cRTw))
cRTw=np.concatenate(  (cRTw,np.float32([[0,0,0,1]])) ,axis=0)
print(str(cRTw))
#=========================================================
eu=0.00001
ev=eu
largeur=800
hauteur=600
fovhdegres=120
demifovhradian=(fovhdegres/2.)*(math.pi/180.)
pu=largeur/2
pv=hauteur/2
alphau=pu/math.tan(demifovhradian)
print(str(alphau))
f=alphau*eu
print(str(f))

alphav=f/ev


iCc=np.float32([[alphau,0,pu,0],[ 0, alphav,pv,0], [0,0,1,0]])
print(str(iCc))

iCw=iCc@cRTw
print(str(iCw))


#############################
def projeterPoint(M):
    print("M:"+str(M))
    M=np.append(M,1)
    print("M:"+str(M))
    m=iCw@M
    print("m:"+str(m))
    #m=m*(1/m[2])
    mu=m[0]/m[2]
    mv=m[1]/m[2]
    #arrondi et cast
    mu=int(round(mu,0))
    mv=int(round(mv,0))
    print("mu:"+str(mu))
    print("mv:"+str(mv))
    return (mu,mv)

#############################

im=np.zeros((hauteur,largeur),np.uint8)

for i in range(len(listeM)):
    (mu,mv)=projeterPoint(listeM[i])
    im[mv,mu]=255


for i in range(len(listeseg)):
    (mu1,mv1)=projeterPoint(listeM[listeseg[i][0]])
    (mu2,mv2)=projeterPoint(listeM[listeseg[i][1]])

    cv2.line(im,(mu1,mv1),(mu2,mv2),255,1,cv2.LINE_AA)

cv2.imwrite('imgcube2025.png',im)

cv2.imshow('image',im)
cv2.waitKey(0)
cv2.destroyAllWindows()
Animation:
- animsynthese.py
Animation synthese


for i in range(100):
    taillecube=1+i*0.01
    listeM = np.float32([[0,0,0], [taillecube,0,0],[taillecube,taillecube,0], [0,taillecube,0],
                    [0,0,taillecube], [taillecube,0,taillecube],[taillecube,taillecube,taillecube], [0,taillecube,taillecube]])
    print("listeM:"+str(listeM))
    listeseg=[[0,1],[1,2],[2,3],[3,0],[4,5],[5,6],[6,7],[7,4],[0,4],[1,5],[2,6],[3,7]]
    print("listeseg:"+str(listeseg))
    #------------------
    #rodrigues
    rvecs = np.float32([0,0,0])
    '''
    rvecs = np.float32([0,2*np.pi*i/100.,0])
    rvecs = np.float32([2*np.pi*i/100.,0,0])

    rvecs = np.float32([0,0,2*np.pi*i/100.])


    '''
    rvecs = np.float32([2*np.pi*i/100.,2*np.pi*i/100.,2*np.pi*i/100.])
------
code pour synthétiser  une image

------

    cv2.imshow('animation', img)
    if cv2.waitKey(1) == ord('q'):

        # press q to terminate the loop
        cv2.destroyAllWindows()
        break
Etalonnage de capteur et Ajustement de paramètres
Exemple de la balance: tpomlbut3
Code pour s'entrainer pour ajuster des fontions quelconques
TP réalité augmentée, reconstruction 3D par vision monoculaire et par stéréovision
- tpstereo.py
#/usr/bin/python3
import numpy as np
import cv2
import glob
filename1="imaobj1_rect.jpg"
filename2="imaobj2_rect.jpg"

img1 = cv2.imread(filename1)
if(len(img1.shape)<3):
    img1 = cv2.cvtColor(img1,cv2.COLOR_GRAY2BGR)
img2 = cv2.imread(filename2)
if(len(img2.shape)<3):
    img2 = cv2.cvtColor(img2,cv2.COLOR_GRAY2BGR)

h,  w = img1.shape[:2]
print("h:"+str(h))
print("w:"+str(w))

#------------------
def projeterPoint(M,iCw):
    #print("M:"+str(M))
    M = np.append(M, 1)
    #print("M:"+str(M))
    m=iCw@M
    #deshomogénéisation
    mu=m[0]/m[2]
    mv=m[1]/m[2]
    #arrondi pour avoir des positions entières
    mu=int(round(mu,0))
    mv=int(round(mv,0))
    #print("mu:"+str(mu))
    #print("mv:"+str(mv))
    return  (mu,mv)
#------------------
alphau=2149.349810656287900
alphav=2146.276553276586100

pu=412.626457723086160
pv=355.723365602020240


rvec1 = np.float32([ -3.125480e-001 , -2.316874e+000 , 1.048207e-001 ])
tvec1 = 0.001 * np.float32([ [4.813190e+001]  , [-1.258122e+002] , [1.066916e+003] ])
rvec2 = np.float32([ 6.592006e-001  , -2.262313e+000 , -3.064294e-001])
tvec2 = 0.001 * np.float32([ [2.557518e+001]  , [-6.888417e+001] , [1.091155e+003] ])

matR1,jac1=cv2.Rodrigues(rvec1)
print("matR1:"+str(matR1))
matR2,jac2=cv2.Rodrigues(rvec2)
print("matR2:"+str(matR2))


#affichage comme TD synthese
cRT1w=np.hstack((matR1,tvec1))
cRT1w = np.vstack((cRT1w,[0,0,0,1]))
cRT2w=np.hstack((matR2,tvec2))
cRT2w = np.vstack((cRT2w,[0,0,0,1]))

print("cRTw: "+str(cRT1w))
#print("mtx: "+str(mtx))
iCc=np.float32([[alphau,0,pu,0],[0,alphav,pv,0],[0,0,1,0]])
print("iCc:"+str(iCc))
iC1w=iCc@cRT1w
print("iC1w:"+str(iC1w))
iC2w=iCc@cRT2w
print("iC2w:"+str(iC2w))


#---------------------------
#TODO: afficher un repère de 10cm de coté sur chaque image sur chaque image
#---------------------------


#liste des points pour les 2 images, mu puis mv
listem1 = np.int_([[490,96], [329,83] , [510,119] , [359,107],
                        [493,156],[339,151],[525,189],[373,180],[507,230],
                        [353,223],[534,253],[385,250],[514,302],[361,304],
                        [544,333],[393,336],[523,377],[369,383],
                        [400,252], # ce point n'est pas observé dans l'image
                        [254,264]])

listem2 = np.int_([[448,194], [290,184] , [450,233] , [297,228],
                        [420,249],[265,243],[427,297],[272,294],[391,311],
                        [241,308],[399,349],[250,354],[366,364],[212,367],
                        [371,408],[216,417],[338,416],[179,420],
                        [316,263], # ce point n'est pas observé dans l'image
                        [162,228]])

if listem2.shape[0]!=listem1.shape[0]:
    print("les 2 listes de points doivent avoir le même nombre de points")
    exit(-1)
listeM=np.zeros((listem2.shape[0],3), np.float32)

#valeur par defaut pour le point 3D reconstruit
X = np.zeros((3,1), np.float32)
Xz0 = np.zeros((3,1), np.float32)

for i,(mu,mv) in enumerate(listem1):
    img1 = cv2.circle(img1,(mu,mv), 3,(255,0,255), -1)
    font = cv2.FONT_HERSHEY_SIMPLEX
    cv2.putText(img1,str(i),(mu+10,mv), font, 1,(255,0,255),2,cv2.LINE_AA)
    #récupère le point correspondant dans l'image 2
    mu2=listem2[i][0]
    mv2=listem2[i][1]
    img2 = cv2.circle(img2,(mu2,mv2), 3,(255,0,255), -1)
    font = cv2.FONT_HERSHEY_SIMPLEX
    cv2.putText(img2,str(i),(mu2+10,mv2), font, 1,(255,0,255),2,cv2.LINE_AA)
    #---------------------------
    #TODO: Remplir listeM[i][:] avec les coordonnées 3D du point i
    #---------------------------


#image composée à partir des 2 images 1 et 2
imagecomposee = np.hstack((img1,img2))
filenameout="imaobj_rect-out.jpg"
cv2.imwrite(filenameout,imagecomposee)
cv2.imshow('dst',imagecomposee)
cv2.waitKey(-1)
cv2.destroyAllWindows()
#-----------------------------------------------
#matplot 3D
#https://www.geeksforgeeks.org/three-dimensional-plotting-in-python-using-matplotlib/
#mettre à True pour activer le rendu 3D après fermeture de la fenêtre opencv
if False:
    # importing mplot3d toolkits
    from mpl_toolkits import mplot3d
    import numpy as np
    import matplotlib.pyplot as plt

    fig = plt.figure()

    # syntax for 3-D projection
    ax = plt.axes(projection ='3d')

    # defining axes
    x = listeM[:,0]
    y = listeM[:,1]
    z = listeM[:,2]
    ax.scatter(x, y, z)
    ax.axis('equal')

    # syntax for plotting
    ax.set_title('3d Scatter plot geeks for geeks')
    plt.show()
Vidéo interpolation de vue
Etalonnage géométrique de la camera
Démo /home/bvandepo/Bureau/pythonb/ueye2023/uEye_SimpleLive_PyuEye_OpenCV/SimpleLive_Pyueye_OpenCV.py
brancher une carte arduino en USB et utiliser mire acrylique
A faire en cas de problème avec visual studio code
Extension Python se met à jour à une version trop récente pour visual studio code
Si vous avez une fenêtre Interactive 1 qui affiche:
[Select a kernel](command:_notebook.selectKernel) to run cells.

- Bandeau à gauche, icône du bas (extensions)
- Taper python dans la zone de recherche
- choisir Python juste en dessous
- à droite de Uninstall, cliquer sur Install Specific Version
- choisir 2025.6.1


