Table des matières
Cours
Installations des outils
Chez vous installer Visual Studio Code: https://code.visualstudio.com/download
Logiciel pour visualiser les images, alternative à geeqie: https://nomacs.org/
version portable à installer sur D:\ : https://github.com/nomacs/nomacs/releases/latest/download/nomacs-portable-win.zip
régler la langue en anglais
Pour relever des coordonnées de pixels dans les images, utiliser Paint.
Installation OpenCV pour Windows IUT
taper dans une invite de commande:
pip install numpy
pip install matplotlib
pip install opencv-python --upgrade
Créer un dossier sur R:\lprob…\…\tpvision et y télécharger le fichier suivant:
- test1.py
import numpy as np
import cv2
import math

print("version openCV:"+str(  cv2.__version__ ))
lancer Visual Studio Code:
code
ouvrir le dossier que vous venez de créer
Run
indique qu'il n'y a pas extension python
cliquer sur install  coté de Python IntelliSense(Pylance) Microsoft
Documentation OpenCV
https://pypi.org/project/opencv-python/
lien vers documentation openCV: https://docs.opencv.org/4.7.0/
TP Prise en main librairie OpenCV via Python
Nous allons commencer par prendre en main la librairie OpenCV via le langage Python: https://opencv24-python-tutorials.readthedocs.io/en/latest/py_tutorials/py_tutorials.html
Image à télécharger dans votre dossier de projet
TP1
- test1.py
import numpy as np
import cv2
import math

print("version openCV:"+str(  cv2.__version__ ))

def trace_carre(u,v,sz):
    global res
    cv2.rectangle(res,(u-sz//2,v-sz//2),(u+sz//2,v+sz//2),(0,255,0),1)


img = cv2.imread('messi5.jpg')
res = cv2.resize(img,None,fx=2, fy=2, interpolation = cv2.INTER_CUBIC)

# Draw a diagonal blue line with thickness of 5 px
cv2.line(res,(0,0),(511,511),(255,0,0),5)
cv2.rectangle(res,(384,0),(510,128),(0,255,0),3)

for i in range (10,300,10):
   print(str(i))
   trace_carre(200,100,i)

#sauver au format png pour compression sans perte
cv2.imwrite('messi5out.png',res)

print("fini")
- tp2.py
import numpy as np
import cv2
import math

print("version openCV:"+str(  cv2.__version__ ))

def trace_carre(u,v,sz):
    global res
    cv2.rectangle(res,(u-sz//2,v-sz//2),(u+sz//2,v+sz//2),(0,255,0),1)


img = cv2.imread('messi5.jpg')
res = cv2.resize(img,None,fx=2, fy=2, interpolation = cv2.INTER_CUBIC)

# Draw a diagonal blue line with thickness of 5 px
cv2.line(res,(0,0),(511,511),(255,0,0),5)
cv2.rectangle(res,(384,0),(510,128),(0,255,0),3)

for i in range (10,300,10):
   print(str(i))
   trace_carre(200,100,i)

u=548;
v=342;
res[v][u-1]=[255,255,255]
res[v][u+1]=[255,255,255]
res[v-1][u]=[255,255,255]
res[v+1][u]=[255,255,255]

res[v][u]=[0,0,255]
print(res[v][u] )

for j in range (0,256):
  for i in range (0,256):
    d=math.sqrt((i-127)*(i-127)+(j-127)*(j-127))
    if d<=128:
      res[100+j][700+i]=[0,j,i]
ballon=res[ 280*2:340*2,330*2:390*2]
v1=100
u1=200
for u1 in range(100,810,200):
  v1=100+int(u1*0.5)
  res[v1:v1+ballon.shape[0],u1:u1+ballon.shape[1]]=ballon
#sauver au format png pour compression sans perte
cv2.imwrite('ballon.png',ballon)

kernel = np.ones((5,5),np.float32)/25
res2 = cv2.filter2D(res,-1,kernel)
res2 = cv2.filter2D(res2,-1,kernel)
res2 = cv2.filter2D(res2,-1,kernel)
res2 = cv2.filter2D(res2,-1,kernel)

blur = cv2.GaussianBlur(img,(5,5),0)
cv2.imwrite('blur.png',blur)

#sauver au format png pour compression sans perte
cv2.imwrite('messi5out.png',res)
cv2.imwrite('messi5out2.png',res2)

print("fini")
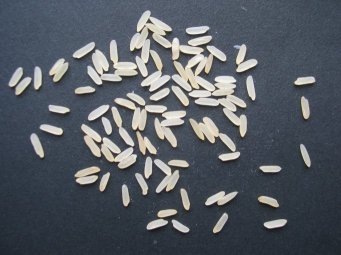
Détection et comptage d'objets
- riz.py
import numpy as np
import cv2
import math

imgcolor = cv2.imread('riz.jpg')

img=cv2.cvtColor(imgcolor, cv2.COLOR_BGR2GRAY);

print(img[0][0])
print(img[254][0])
#ret,thresh1 = cv2.threshold(img,60,255,cv2.THRESH_BINARY)
# find otsu's threshold value with OpenCV function


blur = cv2.GaussianBlur(img,(5,5),0)
ret, thresh1= cv2.threshold(blur,0,255,cv2.THRESH_BINARY+cv2.THRESH_OTSU)

kernel = np.ones((3,3),np.uint8)
erosion = cv2.erode(thresh1,kernel,iterations = 2)
ouverture = cv2.dilate(erosion,kernel,iterations = 1)

contours, hierarchy = cv2.findContours(ouverture,cv2.RETR_TREE,cv2.CHAIN_APPROX_NONE)
i=0
for data in contours:
    print("The contours have this data "+str(data))
    rect = cv2.minAreaRect(data)
    l=rect[1][1]
    m=rect[1][0]
    w=max(l,m)
    h=min(l,m)
    if h>0:
        aspect=float(w/h)
    else:
        aspect=10000000
    area = cv2.contourArea(data)
    hull = cv2.convexHull(data)
    hull_area = cv2.contourArea(hull)
    if hull_area>0:
        solidity=float(area/hull_area)
    else:
        solidity=10000000000

    perimeter = cv2.arcLength(data,True)
    #if i%2==0 :
    if aspect>1.9 and aspect<6 and area>40 and area<200 and solidity>0.8 and perimeter<45:
        cv2.drawContours(imgcolor,data,-1,(0,0,255),1)
        i=i+1
    else:
        cv2.drawContours(imgcolor,data,-1,(0,255,0),1)


print("hierarchy    "+str(hierarchy    ))
#cv2.drawContours(imgcolor,contours,-1,(0,255,0),1)

print(ret)
print ("il y a "+str(i)+ " grains de riz")

#sauver au format png pour compression sans perte
'''cv2.imwrite('riz_ouverture.png',ouverture)
cv2.imwrite('riz_erosion.png',erosion)
cv2.imwrite('riz_thresh1.png',thresh1)
cv2.imwrite('riz_out.png',img)'''
cv2.imwrite('riz_out_contour.png',imgcolor)
cv2.imshow('image',imgcolor)
cv2.waitKey(0)
cv2.destroyAllWindows()
print("fini")

